Buffer overflow attacks explained
How does a typical buffer overflow exploit work in code, at run-time and in memory and what can be achieved by running it?


How does a typical buffer overflow exploit work in code, at run-time and in memory and what can be achieved by running it?
A buffer overflow occurs when a program or process attempts to write more data to a fixed length block of memory (a buffer), than the buffer is allocated to hold. By sending carefully crafted input to an application, an attacker can cause the application to execute arbitrary code, possibly taking over the machine.
Attackers have managed to identify buffer overflows in a many products and components. A few examples are the PS2 Independence exploit, the Twilight Hack for the Wii or an iDevice Lock Activation Bypass on the iPad.
Inside the memory
In order to understand how buffer overflows work, we need to understand what happens in memory when a program is run. In this example we're using a C program in Linux. However, note that the issue applies to many different languages and operating systems.
NOTE: For the purpose of this article and its examples, I have disabled protective measures, like Address Space Layout Randomization (ASLR), that may interfere with a clear demonstration of the buffer overflow issue. There are ways to bypass these measures, but that's a (more advanced) topic in itself. In this article, I will focus on the core principle of buffer overflows.
When a program is run by the operating system (OS), the executable will be held in memory in a very specific way that's consistent between different processes. The operating system will effectively call the main method of the code as a function, which then starts the flow for the rest of the program.
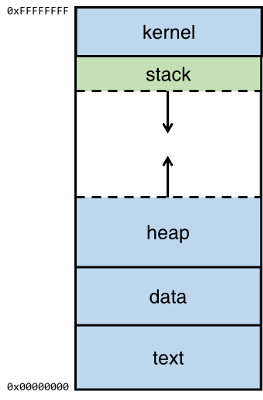
The top of the memory is the kernel area, which contains the command-line parameters that are passed to the program and the environment variables.
The bottom area of the memory is called text and contains the actual code, the compiled machine instructions, of the program. It is a read-only area, because these should not be allowed to be changed.
Above the text is the data, where uninitialized and initialized variables are stored.
On top of the data area, is the heap. This is a big area of memory where large objects are allocated (like images, files, etc.)
Below the kernel is the stack. This holds the local variables for each of the functions. When a new function is called, these are pushed on the end of the stack (see the stack abstract data type for more information on that).
Note that the heap grows up (from low to higher memory) when more memory is required by an application and the stack grows downwards (from high to lower memory).
This stack area is where the magic happens.
The program
Since the stack grows downward, every item pushed on top of the stack, will make it grow towards the low memory address area.
Consider the case where a program calls a function, a piece of code that does something and returns where it was before.
When the call is made, the parameters that are passed to the function, are pushed on top of the stack. With the parameters on the stack, the code of the function will then jump to somewhere else in memory and do something with these parameters. This mechanism is where the trouble starts...
Let's take a look at a simple piece of C-code that does just this. The program calls a function which allocates some memory onto the stack, copies a string from the command line into it and outputs the string with a welcome message.
#include <stdio.h>
#include <string.h>

void func(char *name)
{
    char buf[100];
    strcpy(buf, name);
    printf("Welcome %s\n", buf);
}

int main(int argc, char *argv[])
{
   func(argv[1]);
   return 0;
}
At run-time, the contents of the argc and argv parameters, being parameters of the program, will be held in the kernel area.
The main-method is the entry point for the program and the first thing it does, is to call the func-function, passing the first command-line parameter to it (i.e. argv[1]).
Note that argv[0] contains a value that represents the program name (see also this stackoverflow post).
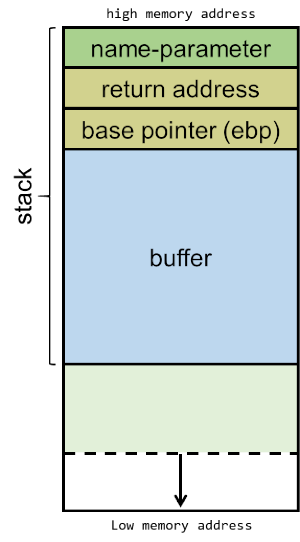
When calling the func-function, the argv[1] value is pushed onto the stack (as the name-parameter for func). When a function has multiple parameters, they are pushed onto the stack in reversed order. So with a call like foo(1, 2), '2' would be pushed first, followed by '1'.
Then, the function should know where to return when the function exits, so the address of the next instruction is pushed onto the stack as the return address. In this code example, the next instruction is the one after func(argv[1]);, which is the memory address for line 14.
The EBP (or extended base pointer) is then pushed onto the stack. This pointer is used to refer to parameters and local variables. For the sake of keeping this explanation simple, we won't go further into details on this. However, this article has a good explanation of the EBP.
Then, a buffer of 100 bytes long is allocated in the stack, followed by a call to the stringcopy function (strcpy) which will copy the name-parameter into the buffer.
After this the contents of the buffer are output together with the welcome message.
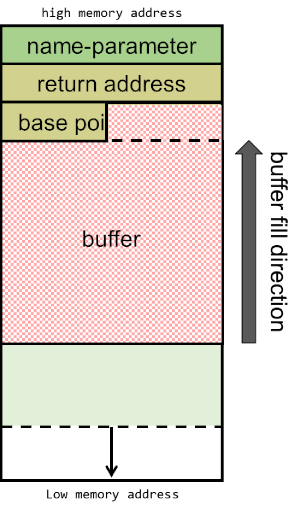
The stack will now be built-up as depicted below, consisting of the name-parameter, followed by the return address, the EBP and the 100-byte buffer:
Runtime
Let's call this program buf and compile the code as 32-bit and generate debugging information like so:
gcc -g -o buf buf.c -m32 (-mpreferred-stack-boundary=2)
When we run it, a typical execution of this program with command-line parameter Mathilda would look like this:
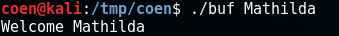
The program has copied 'Mathilda' into the buffer and output the welcome message as expected.
Breaking the code
Now the code is compiled and the buf program was created, let's fire up gdb, the Linux command line debugger.
In gdb, we can use the list command to display the code. Note that this works because we've compiled it with debug information. The code will look familiar:
Usually you won't have the luxury of having the source-code available, which means you will have to dive right into the assembler code.
Disassemble
The command disas func will show the assembler code for the method func:
Reading assembler is a different story and worthy of a blog post (or 10) by itself. However, one important thing to note about the assembler code is the third line sub &0x64, %esp. Here it is allocating 100 bytes for the buffer (0x64 is 100 in hexadecimal).
Overflowing the buffer
Note again that the stack grows downward from high-memory to lower-memory addresses.
However, the buffer itself is filled from lower- to higher memory addresses. This means that if we would pass a name that is bigger than 100 characters long, it would start overwriting the base pointer that's lower in the stack (and higher up in the memory).
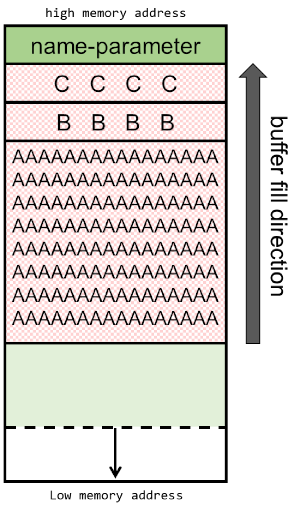
Let's see what happens when we execute the buf-program with a name-parameter of 108 characters long. The 108 characters will be built up by 100 times the letter 'A', 4 times a 'B', followed by 4 times the letter 'C'. Later, when inspecting the program's memory, this distinction of the letters will make it easier to identify the memory segments that were overwritten. We're expecting the first 100 A's to fill the buffer, the B's to overwrite the EBP and the C's to overwrite the return address.
In order to produce the string, I'll use the following python script: python -c 'print "\x41" * 100, which will generate a string with 100 times the character 'A' (0x41 is hexadecimal for 65, which is the ASCII-code for the letter 'A'). To those 100 characters, the four B's (0x42) and the four C's (0x43) will be added, producing a string with a total length of 108 bytes.
From within gdb, the program can be executed using the run-command and when this string is passed to the program, it will produce the following result:
BAM! Segmentation fault. This is an error the CPU produces when you something tries to access a part of the memory it should not be accessing. It didn't happen because a piece of memory was overwritten, it happened because the return address was overwritten with C's (0x43434343). There's nothing at address 0x43434343 and if there is, it does not belong to the program so it is not allowed to read it. This produces the segmentation fault.
Faulty stack
Schematically, the stack will now look like this:
Let's see what the stack looks like in memory in gdb, by executing the command x/100x $sp-200. The first part of this command x/100x reads the memory in a block of 100 bytes in hexadecimal format. $sp-200 will tell it to read the memory from the stackpointer ($sp) position offset by -200 bytes:
Note that this print shows the stack upside-down with the lower memory area on top.
Faulty registers
If we check out the registers by entering the command info registers in gdb, we confirm that the EBP and return address are overwritten:
The EBP-register contains the B's: 0x42424242 and the EIP-register contains the C's: 0x43434343. The EIP (Extended Instruction Pointer) contains the address of the next instruction to be executed, which now points to the faulty address.
Now 0x43434343 is a faulty address. However, if this address would point to malicious code, we could have a problem. Well... the problem would exist from the programmer's point of view, because from a hacker's perspective, this is exactly what we want to achieve.
Exploiting the code
We've seen how to change the return address. In order to exploit the problem with the buffer we aim to change the return address to somewhere we would have some code that, when executed, could do something beneficial to us as an attacker; like launching a shell.
Create the shellcode
A shellcode is a small piece of code used as the payload in the exploitation of a software vulnerability. It is called "shellcode" because it typically starts a command shell from which the attacker can control the compromised machine, but any piece of code that performs a similar task can be called shellcode.
The art of crafting shellcode is a blog post of its own. Shellcodes depend on the operating system and CPU and are commonly written in assembler. Many samples of shellcode can be found on the Internet (exploit-db) and the piece we're using here is one that spawns a command shell.
xor     eax, eax    ; Clearing eax register
push    eax         ; Pushing NULL bytes
push    0x68732f2f  ; Pushing //sh
push    0x6e69622f  ; Pushing /bin
mov     ebx, esp    ; ebx now has address of /bin//sh
push    eax         ; Pushing NULL byte
mov     edx, esp    ; edx now has address of NULL byte
push    ebx         ; Pushing address of /bin//sh
mov     ecx, esp    ; ecx now has address of address
                    ; of /bin//sh byte
mov     al, 11      ; syscall number of execve is 11
int     0x80        ; Make the system call
Create a file called shellcode.asm and add the code above. Assemble it using nasm:
nasm -f elf shellcode.asmThis produces a shellcode.o file in Executable and Linkable Format (ELF) file format.
When we disassemble this file using objdump, we get the shellcode bytes:
Now extract the 25 bytes of shellcode:
\x31\xc0\x50\x68\x2f\x2f\x73\x68\x68\x2f\x62\x69\x6e\x89\xe3\x50\x89\xe2\x53\x89\xe1\xb0\x0b\xcd\x80Place the shellcode
Our goal is to get the faulty program buf to execute the shellcode. In order to do this, we will pass the shellcode as the command-line parameter so it will eventually end up in the buffer. We then overwrite the return address (the C's in the previous example) so it will point back to a memory address somewhere in the buffer. This will make the program jump to the shellcode and execute that code instead of the regular program.
Memory may move around a bit during execution of the program, so we do not exactly know on which address the shellcode will start in the buffer. The NOP-sled is a way to deal with this.
NOP-sled
A NOP-sled is a sequence of NOP (no-operation) instructions meant to "slide" the CPU's instruction execution flow to the next memory address. Anywhere the return address lands in the NOP-sled, it's going to slide along the buffer until it hits the start of the shellcode. NOP-values may differ per CPU, but for the OS and CPU we're aiming at, the NOP-value is \x90.
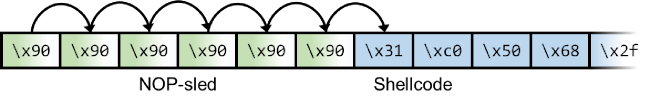
With a NOP-sled, it doesn't matter where the shellcode is in the buffer for the return address to hit it. What we do know is that it will be somewhere in the buffer and its size will be 25 bytes.
With a shellcode of 25 bytes and a payload of 108 bytes, we have 83 bytes left to fill, which we will divide on both sides of the shellcode like this:
Payload: [ NOP SLED ][ SHELLCODE ][ 20 x 'E' ]
The NOP-sled will be placed at the start of the payload, followed by the shellcode. After the shellcode we will place a filler, for now consisting of a bunch of 'E' characters (0x45 in hexadecimal). This filler will later be replaced by the memory address pointing to somewhere in the NOP-sled inside the buffer.
The following image depicts what we expect our memory to look like after execution with the given payload:
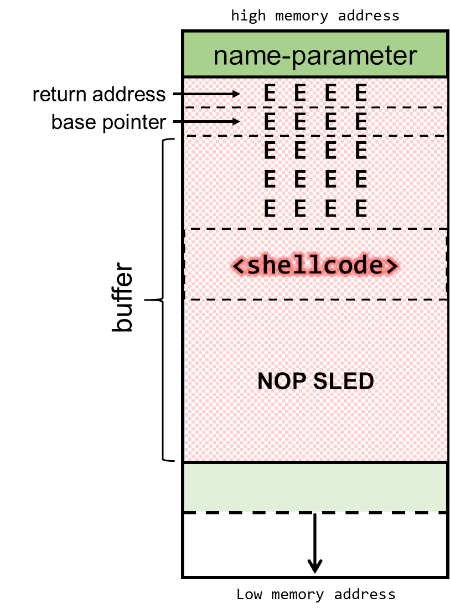
For this example I chose a block of E's with a size of 20 (5 times 4 bytes). This means we have 63 bytes left for the NOP-sled in a 108-byte payload.
The size of the block of E's does not really matter, but we want it to be at least 4 bytes since it must contain a full memory address. Also, a bigger NOP-sled has the advantage that we have a higher chance of hitting it with the memory jump that we're trying to achieve, even if memory gets reallocated a bit at runtime.
Executing the payload
When we run the program with the payload built in the previous chapter, the following output is produced:
Again, I've used the python code to generate a NOP-sled of 63 bytes, concatenated with the shellcode and 5 times 4 bytes of E's.
As we can see the program outputs a Welcome message that shows the content of the buffer (notice the /bin and //sh in reverse order and the 20 E's) and generates a segmentation fault.
The address mentioned in the segmentation fault is 0x45454545, which shows that the E's correctly ended up at the return address.
Fixing the payload
Inspecting the memory of the program when it crashed, we can confirm the payload was placed as expected:
The left-most column in this image contains the memory address of the left-most byte in the row. Using this we now know the runtime memory addresses that contain the payload. This means we can pick an address somewhere in the NOP-sled for the return address to point to. In this case I chose 0xbffffd6c, the memory location marked by a blue box in the image above. This is the address that we will put in the payload instead of the E's.
From a memory's point of view, the payload will be inserted in the buffer from the top of the stack towards the bottom (lower to higher memory). The return address will be read in reverse order, from the bottom of the stack towards the top:

In order for the return address to be read correctly, the bytes need to be written into the payload reversed order, so 0xbffffd6c should be written as 0x6cfdffbf in the payload.
Woot!
When we replace the 5 x 0x45454545 ('E') in the payload by 5 x 0x6cfdffbf, we will have the return address point to the memory location in the NOP-sled. At runtime the CPU's instruction execution flow will "slide" towards the shellcode, execute it and run a shell with the privileges of the buf-program.
Putting it all together, the execution looks like this:

As we can see the buffer overflow was successfully exploited and we gained a command shell running as root.
envexec.sh
Note that I ran buf via a script called envexec.sh instead of calling it directly. This is done to work around some issues with memory allocation, especially the mismatch between stack addresses in the debugger (gdb) and the addresses during normal execution. The envexec-script will take care of this and makes sure the stack memory offsets are equal. For more information see this post on StackOverflow.
You can download the envexec.sh script from my scripts GitHub repository.
Cover photo by Kay Pat